Spring Endowment Update

Each year, the cultivation of Bucknell's endowment combines carefully invested resources with a focus on reliability, astute planning and lasting returns. This revenue leaves an enduring mark on present and future students, and enhances accessibility, academic excellence and the student experience. The Bucknell Investment Office remains steadfast in its prudent management of funds, guided by the discerning oversight of the Board of Trustees' Investment Committee. Donors who contribute with an eye toward the future enact an immediate and enduring impact on current and future students.
Our annual spring endowment update provides insight into the fund's mid-year standing and reflects preliminary, unaudited financial performance. The endowment's diversified portfolio of assets provided resilience in the first half of the year, with each public asset class contributing positively to absolute return. Private valuations are lagged by a quarter.
The endowment's mid-year report serves as a checkpoint to highlight drivers influencing performance for the fiscal year to date. It should not be interpreted as a definitive measure of the endowment's true performance. This is particularly important given that private market valuations — such as private equity, venture capital and real assets — are reported with a time lag. As a result, the data reflected in this mid-year report often does not capture current or complete performance for these asset classes. This timing mismatch makes mid-year comparisons across asset classes, or against the policy benchmark, inherently inconsistent and not directly comparable.
2024 Market Overview
2024 was a year of resilience for global financial markets, with strong performance in some sectors, volatility in others, and notable shifts in domestic and international markets. The year surpassed expectations, with U.S. equities leading the way, primarily driven by large-cap technology stocks. The S&P 500 delivered a solid return of approximately 25%, following a 26.3% return in 2023. A significant portion of this growth was fueled by the "Magnificent Seven" tech giants, underscoring the dominant role of the technology sector in the broader market performance.
In response to inflation, the Federal Reserve took steps to manage economic conditions, cutting interest rates several times by the end of the year. While these rate cuts supported growth, they also contributed to volatility in the bond market. These actions led to mixed results in fixed income markets, with U.S. Treasury yields rising slightly at the longer end of the curve.
International markets, especially in Europe and emerging economies, faced headwinds. Concerns about potential tariffs under the new U.S. administration and the impact of rising interest rates weighed on performance. The administration's plans to impose tariffs on goods imported from Mexico, Canada and China intensified uncertainties in international markets as the year ended. In Asia, China's market experienced moderate growth, supported by government efforts to bolster tech companies.
Private equity markets showed signs of recovery in 2024, with exit activity surpassing 2022 and 2023 levels. This improvement provided better opportunities for institutional investors. The secondary market also grew, offering more options for managing liquidity as distributions slowed. The private equity market demonstrated greater confidence, although challenges like inflation and geopolitical risks persisted.
U.S. private real estate markets showed signs of moderation compared to previous years. Commercial real estate began to recover as interest rates fell and inflation eased, while the office sector faced difficulties. Industrial real estate fundamentals remained strong, benefiting from data center expansion, continued e-commerce growth and limited supply.
Private credit continued to experience significant growth, driven by the expansion of new structures beyond direct lending, the ongoing retrenchment of bank lending and new investors entering the market. Allocations to specialty finance and asset-backed finance structures increased and CLO issuance within the middle market doubled over the last few years. The asset class is increasingly aligning with private equity and banks to create more synergies.
Global growth remains positive, with a 2.5% GDP increase projected for 2025. However, inflation and geopolitical tensions — particularly trade concerns — continue to pose risks. Central banks worldwide adopted varied approaches, with the U.S. grappling with inflation and tariffs. Other regions took more accommodative stances.
Net Performance
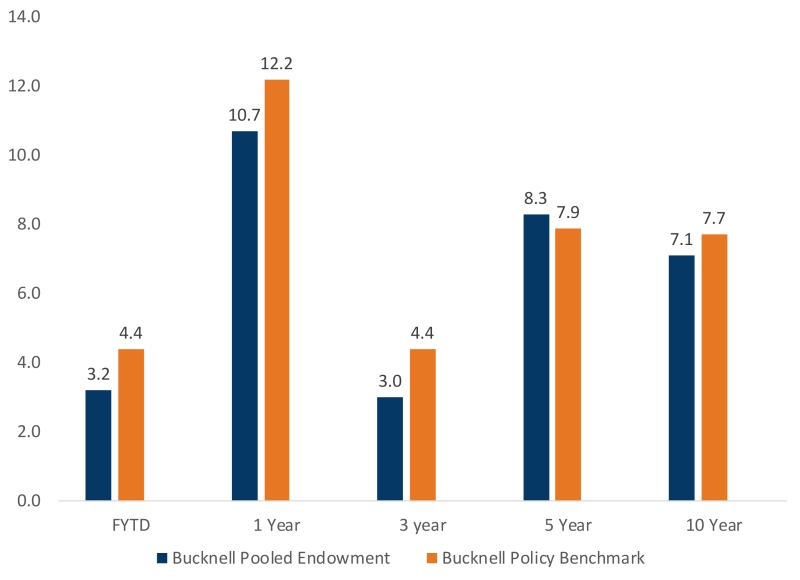
Spring net performance numbers are based on unaudited financial data.
Asset Allocation
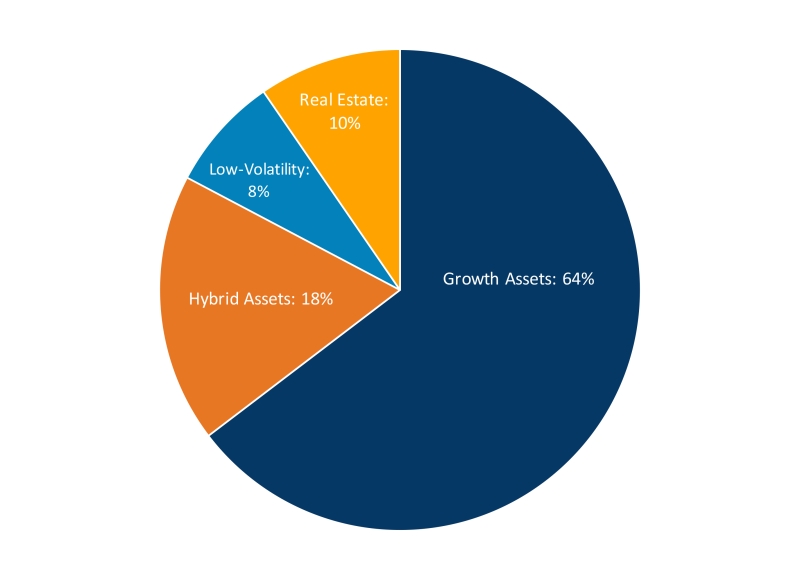
Asset allocation helps investors manage risk, diversifying across different asset classes to reduce the impact of any single investment's performance. By adjusting the mix of assets, investors can align their portfolio with their financial objectives and risk tolerance to maximize returns.
Strategy Performance
Growth Assets
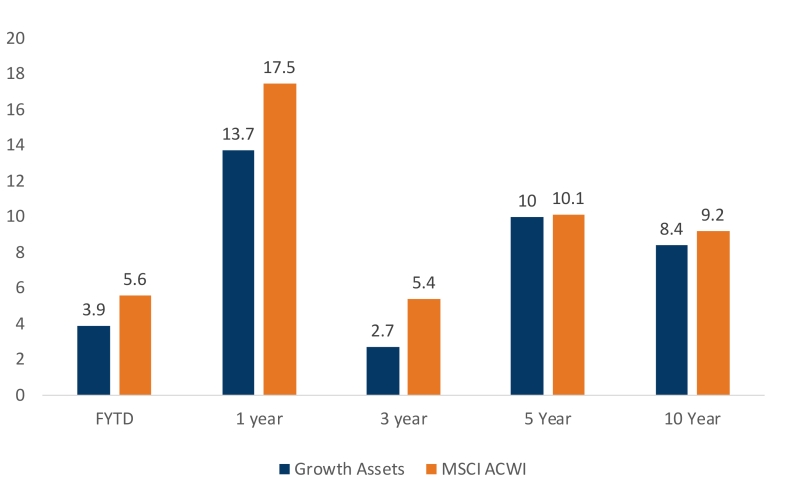
Growth assets aim for long-term capital appreciation. These investments often have higher returns combined with higher volatility. This group consists of U.S. and non U.S. public and private equity investments where private investments lag their market value adjustments by a quarter.
Hybrid Assets
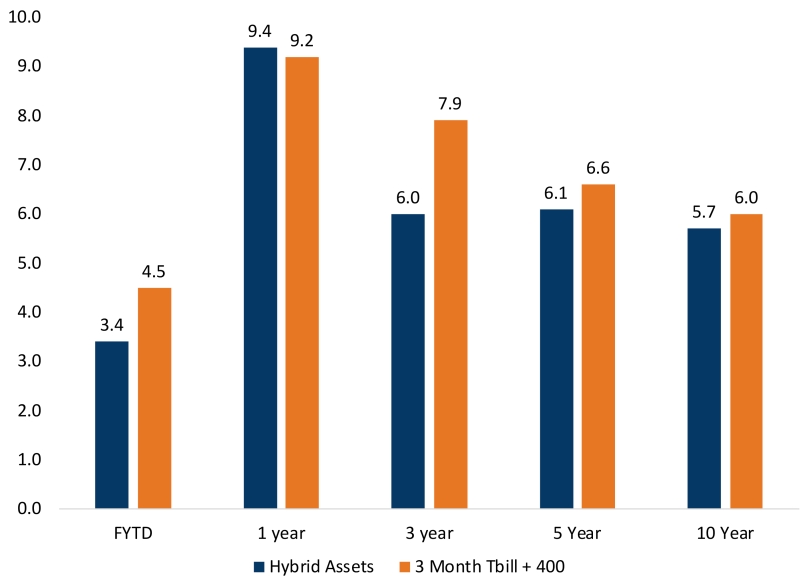
Hybrid Assets offer distinct returns compared to traditional growth assets. They enhance portfolio diversification and mitigate the impact of endowment volatility, especially during periods of market or economic stress. These investments typically exhibit lower correlation with growth assets. They also include credit, which contributes to attractive income generation and improves overall portfolio liquidity and hedged opportunistic strategies, such as long/short equity, event-driven and macro strategies.
Real Estate
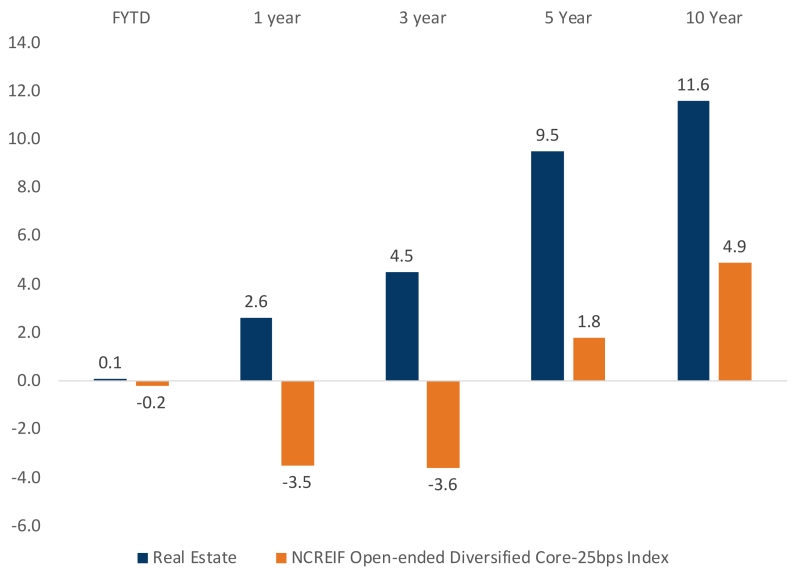
Real estate produces current income and capital appreciation. The real estate portfolio is allocated to private real estate strategies diversified by geography and property type, shying away from sub-sectors most prone to interest rate fluctuations and investor sentiment.
Low Volatility
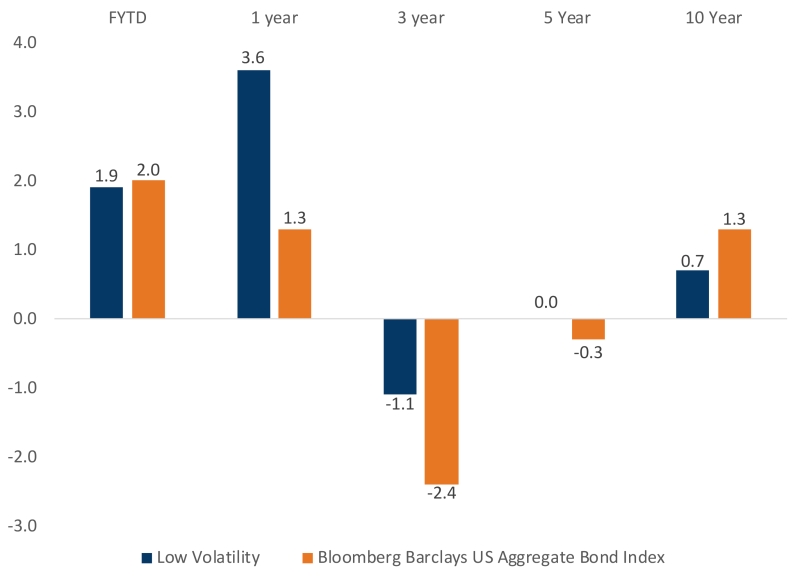
Low-volatility assets, primarily cash and high-quality fixed income, provide stable liquidity to meet annual operating support for the University and diversification in portfolio construction.