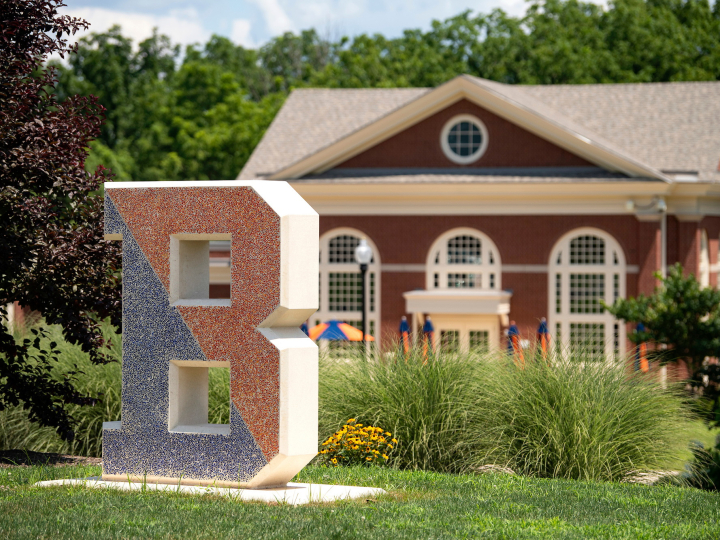
With GIS, Bucknell Geography Students Learn to Convey Complex Stories Through Visually Rich Maps
February 8, 2022
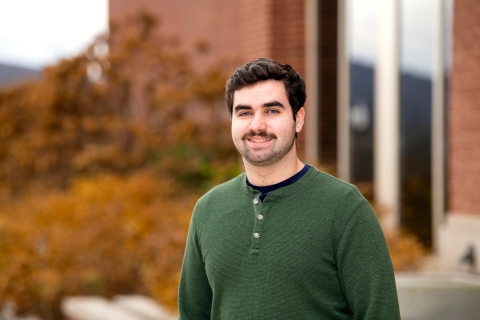
Bucknell geography students like Genevieve Block '22 (left) and Laura Shaffer '22 are learning a powerful skill that helps them interpret massive data sets in new ways. Photo by Emily Paine, Communications
Even a monochromatic Excel spreadsheet has a story to tell. Hidden within its rows and columns of data are narratives that might inform decision-making, illuminate trends or uncover injustice.
The tricky part is knowing how to identify those stories and present them in a way that will make others pay attention and understand.
Enter the GIS scientists.
In the fast-growing field of GIS, or geographic information systems, scientists use specialized software to transform vast data sets into interactive, visually rich maps. Their work democratizes the data by making it accessible to anyone with the internet — even those who are less inclined to poke around in Excel.
At Bucknell, geography students learn these skills as undergrads through courses like GEOG 204: Applied GIS. Using real-world data, they create maps that convey information in a new way, helping uncover storylines others might have missed.
"I guess this is a little cliché, but you know that saying, 'A picture's worth 1,000 words?' When something is represented in a table, all of the data points come across separately," says Melaina Polan '22, a geography and environmental studies double-major from Revere, Mass.
"But then once it's in a picture on a map, that's forcing you to think spatially. It's really just painting a picture of what exactly is going on."
Polan says her GIS skills helped land her an internship at the utility company National Grid.
"During the interview process, I could tell that knowing and being familiar with GIS made me a more qualified candidate," she says.
That internship led to a full-time offer for Polan, who will start at National Grid after graduating.
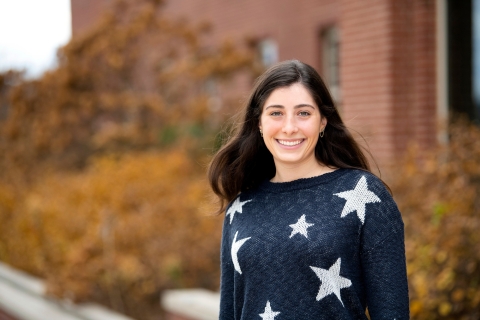
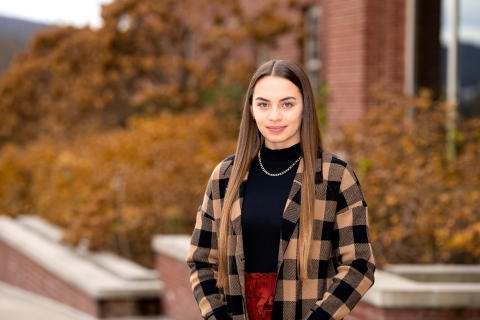
Genevieve Block '22 says she enjoys GIS work because "when you're actually working with real-world data, it gives you more inspiration on the project." Photo by Emily Paine, Communications
Harnessing a 'Powerful Tool'
For her honors thesis, Genevieve Block '22, a geography and Spanish double-major from Towson, Md., used GIS to study the connection between people in Baltimore who have been affected by environmental toxins and their susceptibility to death by COVID-19.
In an effort to enhance the written words in her essay, Block will use her GIS skills to visualize the information on a map, helping underscore the information in a different way.
"It's just such a powerful tool," Block says. "It can really have an impact and hopefully change the way that cities are designed and the way that minority populations are treated in the development of urban areas."
Laura Shaffer '22, a geography major from Albany N.Y., also sees the appeal of covering uncharted ground.
"It's really exciting to think that you could be making the first map ever of something," she says. "You could be making a new discovery that changes how people look at the world."
Shaffer used GIS in an internship to map the walkability of neighborhoods — a skill she hopes will lead to her dream job as an urban planner. After graduating from Bucknell, she will be attending graduate school for urban planning.
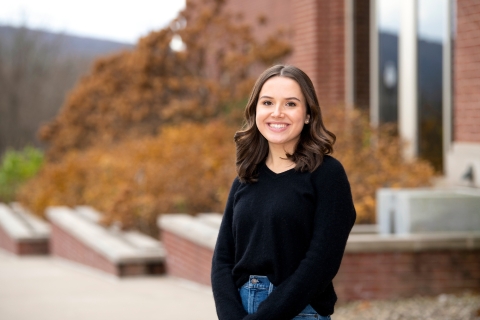
Laura Shaffer '22 says her geography classes opened her eyes to "how much power is different across space — learning about the global North vs. the global South and how different regions have been disadvantaged." Photo by Emily Paine, Communications
An Ethical Approach
Shaffer says Bucknell does more than teach students to master software like ArcGIS. The University also challenges them to ponder the ethical and moral responsibility someone bears when presenting information visually.
Making a few seemingly simple changes to the symbols or colors used on a map can drastically change the viewer's perception of the information. While numbers themselves are objective facts, their presentation can be subjective. For example: At what point does a city's walkability score turn from green to red?
"There's such an important moral component of making GIS maps," Shaffer says. "You have to be very conscious of how you're representing places. Some of the maps you see aren't necessarily depicting places or ideas accurately. GIS has made me be more critical of those things."
Colin Horan '23 believes that words and numbers only go so far. "You can read an article or see a headline about something," he says, "but when it's represented through a story map, you can really make it more powerful for whoever is viewing it." Photo by Emily Paine, Communications
Hands-on From Day One
Colin Horan '23, a geography and history double-major from West Hartford, Conn., remembers his first geography course at Bucknell.
He was asked to look through the clothes in his room and find the tags, seeing where that garment was made. Then he researched those places to get a closer understanding of how that product made its way to the East Coast.
"It was just very hands-on," Horan says. "And for me, it's a very interesting subject matter."
That assignment provided a base layer for Horan's understanding of our greater world, but it was only the beginning. After learning GIS, more doors opened for Horan. He landed an internship with the city of Hartford, Conn., to work on the city's Complete Streets Plan.
Stories like these come as little surprise to Professor Adrian Mulligan, geography. He says employers in a range of industries "have woken up" to the possibilities of hiring a person with GIS mapping skills.
It comes full circle. The prospect of developing in-demand skills, in turn, causes more students to be interested in geography.
"People don't always know what it is, but our courses are always full to the brim," Mulligan says. "It's all about critical spatial thinking, and whether it's making sense of the pandemic, racism, climate change, or how all those things are related, geography really joins the dots."
Melaina Polan '22 says GIS is about "painting a picture of what exactly is going on." Photo by Emily Paine, Communications